
Pest management
Growing degree days: how growers time pest sprays
By the Sutter Butte Dusters team · · 9 min read
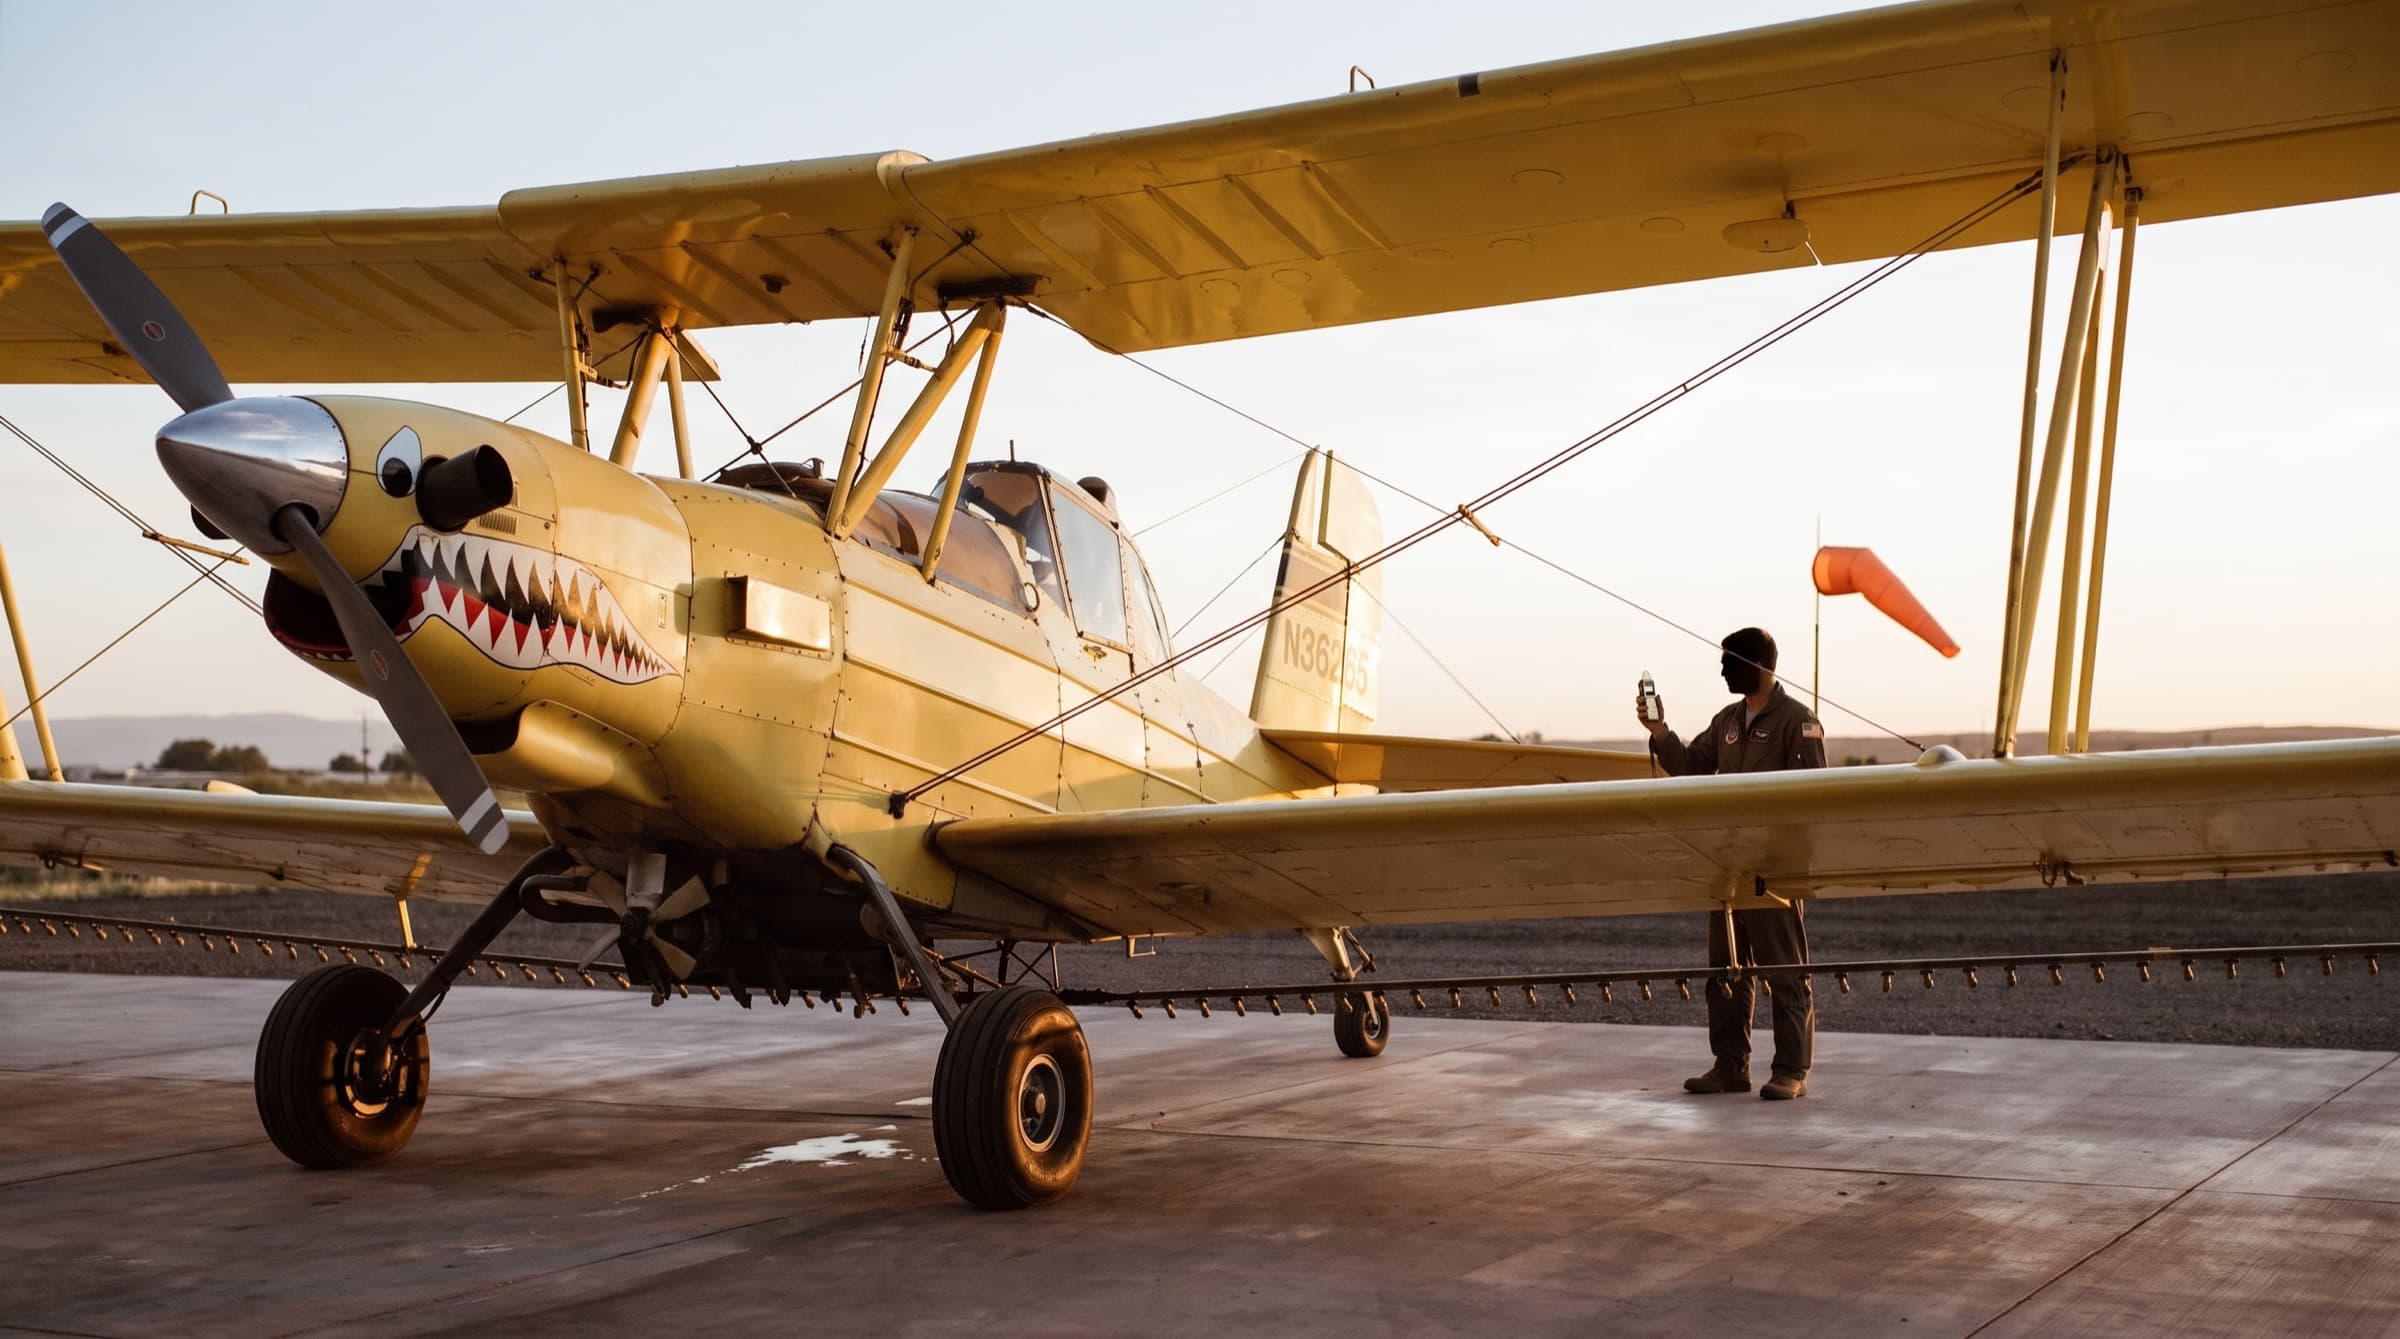
Growing degree days measure the heat that a crop or an insect collects over time. Pest control advisers (PCAs) use them to predict egg hatch in orchard pests and to set the spray date. This post explains the formula, thresholds, biofix, UC models and crop uses, with 2022 to 2026 weather from the Live Oak station.
What are growing degree days?
One degree day (DD) is 24 hours at 1°F above the lower threshold of an organism. Insects are cold-blooded, so their speed of development depends on temperature. A codling moth egg needs the same total heat to hatch in a warm week or a cool week.
The University of California Statewide IPM Program (UC IPM) uses two limits for each pest (UC IPM: About degree-days):
- The lower threshold is the temperature below which development stops.
- The upper threshold is the temperature above which development slows or stops.
Each life stage needs a known total of degree days between those two limits. When the running total reaches that number, the stage arrives. This post uses the shorter term "degree days" from here on.
Do not mix units. Nine Fahrenheit degree days equal 5 Celsius degree days. All numbers in this post are Fahrenheit.
What is the growing degree days formula?
The simple formula uses the daily high and low temperature:
Degree days for one day = (maximum temperature + minimum temperature) ÷ 2 − lower threshold
If the result is less than zero, record zero. Add each day to the running total.
On April 9, 2026, the Live Oak weather station recorded a high of 83.4°F and a low of 44.0°F. With a lower threshold of 50°F, the simple formula gives (83.4 + 44.0) ÷ 2 − 50 = 13.7 DD. The UC IPM calculator reported 14.7 DD for the same day. The simple average counts the cold night hours under 50°F as negative heat, but the insect does not develop backward.
For that reason, UC IPM fits a sine curve to the day's high and low. The model then counts only the area between the two thresholds.
The upper threshold matters in our valley. From 2022 to 2026, Live Oak passed 88°F on 76 to 98 days between April 1 and September 30. On August 3, 2026, Live Oak recorded 104.4°F and 57.3°F. The simple formula gives 30.8 DD. The UC codling moth table, with an upper threshold of 88°F and a horizontal cutoff, gives about 27 DD.
Which calculation method should you use?
Use the same method as the research behind the model. If you do not know that method, UC IPM recommends the single sine method with a horizontal cutoff. It has been the most common method in California for many years.
| Choice | What it assumes |
|---|---|
| Single triangle | Straight lines from the low to the high and back to the same low |
| Single sine | A sine curve through the day's high and low |
| Double triangle or double sine | The same shapes over two half-days; the second half uses the next day's low |
| Huber's method | Single sine with a horizontal cutoff, minus 0.3 DD on days between both thresholds |
| Horizontal cutoff | Development continues at a constant rate above the upper threshold |
| Intermediate cutoff | Development slows above the upper threshold |
| Vertical cutoff | No development above the upper threshold |
What thresholds do common orchard pests use?
Each pest has its own thresholds and start event. The table shows values from the UC IPM guidelines for codling moth in walnut, navel orangeworm in almond and peach twig borer.
| Pest and crop | Lower / upper threshold | Biofix (start event) | UC IPM degree-day targets |
|---|---|---|---|
| Codling moth, walnut | 50°F / 88°F | First date with moths in traps on a consistent basis and sunset temperatures at 62°F | First spray at 300 DD (250 DD for an insect growth regulator), or at small nutlets if later; low pressure: wait for the 1B peak, at 600 to 700 DD; second biofix near 1,060 DD |
| Peach twig borer, peach | 50°F / 88°F | First moth in pheromone traps | About 400 DD if fruit is green; 300 DD if fruit has started to color |
| Peach twig borer, almond | 50°F / 88°F | First male trapped, with moths on at least two checks in a row | About 400 DD for several insecticide classes; 300 to 400 DD for an insect growth regulator |
| Navel orangeworm, almond | 55°F / 94°F | Eggs rise on egg traps for two checks in a row, or 50 percent of traps have eggs | First-brood egg hatch at 100 DD |
Not every pest runs on a model. For example, the walnut husk fly program depends on trap catches and egg checks in the female flies.
Do crops use growing degree days too?
Yes. Crops follow the same heat clock as insects. UC IPM lists a sweet corn phenology model with thresholds of 50°F and 86°F. The count starts on the planting date.
| Sweet corn stage | Degree days from planting |
|---|---|
| 50 percent of silks out | 1,062 DD |
| Mature for fresh market | 1,539 DD |
| Mature for processing | 1,597 DD |
The model comes from field studies in western Oregon. UC IPM advises that you test a model for one or more seasons in your own location before you rely on it.
What is a biofix, and when does it happen here?
The biofix is the date when you start the count. It is a biological event in your own orchard, such as the first steady moth catch. It is not January 1 or any other fixed calendar date.
UC IPM gives these monitoring dates:
- Codling moth: hang traps in early March. The first flight starts between early March and early April.
- Peach twig borer: install pheromone traps by April 1 in the Sacramento Valley.
- Navel orangeworm: put egg traps out by March 15, with 1 trap for each 10 acres and at least 4 traps for each orchard.
UC IPM notes that navel orangeworm is usually less abundant in the Sacramento Valley than in the mid and southern San Joaquin Valley. The navel orangeworm program here depends on sanitation, an early harvest and hull split checks.
How to set a codling moth biofix
- Hang pheromone traps in the walnut orchard in early March.
- Put each standard trap in the southeast part of the tree, 6 to 7 feet high.
- Check the traps and record the count for each trap.
- Record the temperature at sunset each evening.
- Mark the first date with a steady catch and a sunset temperature of 62°F or more.
- Use that date as the start date in the calculator.
- Clean the traps near 700 DD and check them more often.
The codling moth post covers trap types, the 1A and 1B flight peaks and nut drop counts.
How do you use a growing degree days calculator?
The UC IPM degree-day calculator is free. It uses data from CIMIS stations (the California Irrigation Management Information System) and UC IPM PestCast stations. The pest models use the same data, with the thresholds for each pest already set.
- Open the calculator, or open the pest model for your pest and crop.
- Enter the lower and upper thresholds from the pest guidelines.
- Select the calculation method and the cutoff method.
- Search for the station nearest to your orchard.
- Enter your biofix as the start date.
- Enter a future end date to add long-term averages as a forecast.
- Read the daily and accumulated degree days in the report.
The report also counts the values from your station and from averages. You can download it as a CSV file.
Can you get growing degree days by zip code?
National tools give degree days by ZIP code. The top-ranked tool offers a base temperature of 50°F or 32°F and no upper threshold. For a California orchard pest, pick a named station and the correct pest model.
In October 2026, we searched each county name in the UC IPM calculator. The search returned these active stations:
| County | Stations in the UC IPM calculator |
|---|---|
| Sutter | Live Oak (PestCast), Verona (CIMIS 235) |
| Butte | Biggs (CIMIS 244) |
| Yuba | Browns Valley (CIMIS 84) |
| Colusa | Williams (CIMIS 250) |
| Yolo | Woodland (CIMIS 226), Davis (CIMIS 6) |
| Placer | Auburn (CIMIS 195) |
| Glenn | None; compare Williams, Biggs and Gerber South (CIMIS 222, Tehama County) |
Two older stations no longer report. The CIMIS station list shows that Durham (CIMIS 12, Butte County) closed on July 30, 2025. Orland (CIMIS 61, Glenn County) closed on May 26, 2010.
Elevation, shade, wind and nearby water make your orchard differ from any station. An on-site station gives the closest numbers.
How much do degree days vary from year to year?
We downloaded the daily highs and lows for the Live Oak PestCast station (UC IPM station 278) for 2022 to 2026. We applied the codling moth thresholds (50°F and 88°F) with the single sine method and a horizontal cutoff. Each year starts from the same example biofix of April 1.
| Year | 300 DD reached | 700 DD reached | 1,060 DD reached | May total |
|---|---|---|---|---|
| 2022 | April 28 | May 25 | June 12 | 486 DD |
| 2023 | April 30 | May 29 | June 18 | 436 DD |
| 2024 | April 29 | May 25 | June 11 | 502 DD |
| 2025 | April 29 | May 23 | June 10 | 523 DD |
| 2026 | April 29 | May 22 | June 11 | 532 DD |
A run with no upper cutoff can reach a target a day earlier, so check the cutoff in each report header. The cool May of 2023 put the 1,060 DD date about a week later than in other years. A later biofix moves every target. In 2026, an April 15 biofix put 300 DD on May 10.
The same 2026 weather gives these dates for the other two pests, from an example biofix of April 15:
- Peach twig borer (50°F and 88°F): 300 DD on May 10 and 400 DD on May 15.
- Navel orangeworm (55°F and 94°F): 100 DD, the first-brood egg hatch, on April 30.
How do degree days set the date for an aerial spray?
Degree days give the window, and the window is short. In May 2026, Live Oak collected about 17 DD each day for codling moth. From the April 15 example biofix, 250 DD came on May 7 and 300 DD on May 10. The forecast sets the week, and the traps confirm the model.
Degree days are one part of integrated pest management. They do not replace traps, crop scouting or nut checks. A model can only time a pest that is present.
Caution: Degree days do not choose a product or a rate. Follow the label and the written recommendation of your licensed PCA.
- Run the forecast 7 to 10 days before the target.
- Ask your PCA for the written recommendation.
- Send the recommendation and the field map to the applicator.
- Mark power lines, homes and beehives on the map.
- Confirm the target date when the count is 2 or 3 days away.
Our field preparation checklist lists what the pilot needs before the flight. The peach twig borer post shows how the May spray fits with the dormant and bloom options.
Degree days and our work in the northern Sacramento Valley
We fly crop protection for orchards across Sutter, Yuba, Butte, Glenn, Colusa, Placer and Yolo counties from our strip in Live Oak. Many orchard insecticide sprays follow a degree-day count. Our usual time from a grower's call to a plane over the field is 24 hours. That speed matters when a window is only a few days long. When your PCA's count approaches the target, get a quote for your field.
Questions
Add the daily high and low, divide by 2, and subtract the lower threshold. Record zero for a negative result, then add each day to a running total. UC IPM models use a sine curve instead, which counts only the heat between the lower and upper thresholds.
GDD is short for growing degree day, a unit of accumulated heat. Crops and insects need a set amount of heat to reach each growth stage. For example, a UC IPM sweet corn model puts 50 percent silking at about 1,062 degree days after planting, with thresholds of 50°F and 86°F.
Use the threshold from the research behind your pest or crop model. Many tools use 50°F, but navel orangeworm uses 55°F and San Jose scale uses 51°F, according to UC IPM. Use the same upper threshold and calculation method as the model, too.
Yes. The UC Statewide IPM Program offers a free degree-day calculator and pest models. They use CIMIS and PestCast weather stations, and they can show a forecast. In Sutter County, the tool lists the Live Oak PestCast station and the Verona CIMIS station.