
Crop nutrition
Nitrogen deficiency in crops: signs, tests and fixes
By the Sutter Butte Dusters team · · 9 min read
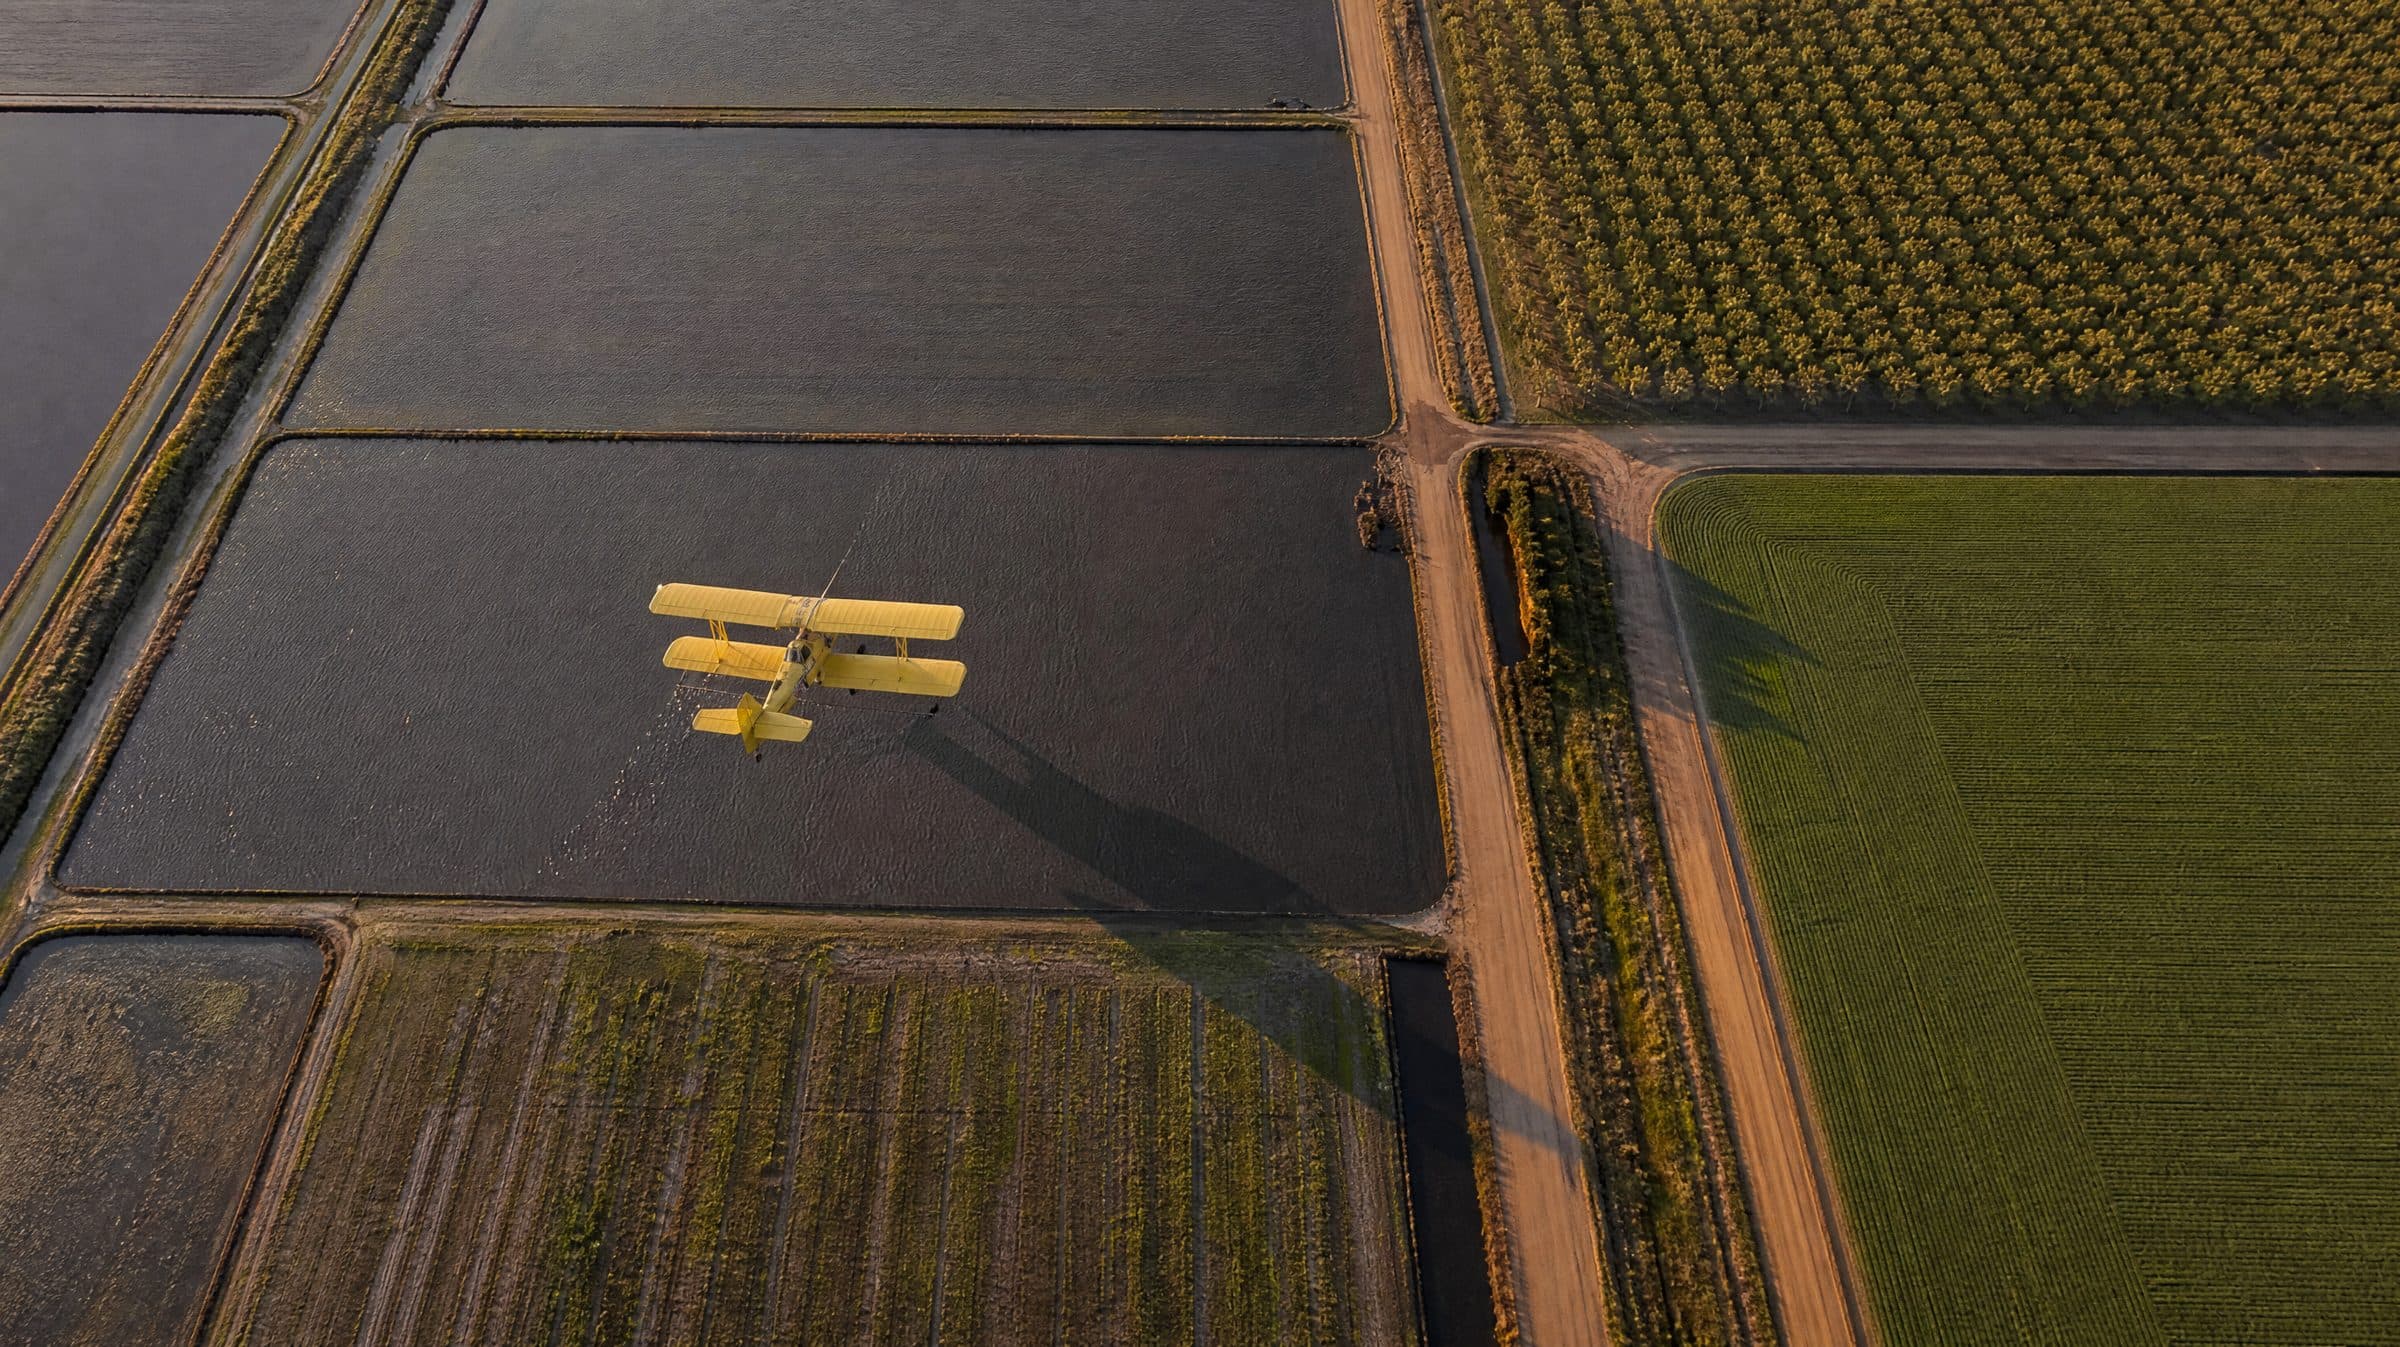
Nitrogen deficiency is a common reason a valley crop turns pale and stops growing. A lab test tells you if the crop is truly short, and the calendar tells you if a fix still pays. This guide covers signs, tests, fix rates and timing for Sacramento Valley rice, wheat, corn, tomatoes and orchards.
What does nitrogen deficiency look like?
The first sign is an even, pale yellow-green color on the oldest leaves, with slow growth. Nitrogen is a mobile nutrient. When the soil supply runs short, the plant moves nitrogen out of old leaves and into new growth. The old leaves yellow first, while the newest leaves stay greener.
These nitrogen deficiency symptoms are common to most crops:
- Short plants, thin stems and small leaves.
- A sparse canopy and short shoots in orchards.
- Early yellow color and early leaf drop in the fall.
- Smaller fruit and lower yield.
Yield can drop before the color changes, as the CDFA walnut and corn guidelines note. For nitrogen deficiency in plants of almost every kind, a tissue test is a better guide than the eye.
Which test shows the deficiency in each crop?
Most values below are a UC critical value or the low end of a sufficiency range. A lower result points to a shortage but does not prove one alone.
| Crop | Test and timing | Reading that points to a shortage |
|---|---|---|
| Rice | Y-leaf at panicle initiation | Under 3.2% N; 3.0 to 3.2% is the critical range |
| Wheat | Lower 2 inches of the stem at tillering | Under the 6,000 to 8,000 ppm nitrate-N sufficiency range |
| Corn | Soil nitrate in the top foot when corn is 6 to 12 inches tall | Under 10 ppm calls for a full sidedress rate |
| Processing tomatoes | Fourth leaf from the tip at first bloom | Under 4.6% N, the low end of the optimal range |
| Almonds | Spur leaves in July | Under 2.0% N |
| Walnuts | Terminal leaflets of spur leaves in July | Under 2.1% N |
| Prunes | Nonbearing spur leaves in July | Under 2.2% N |
| Peaches | Mid-shoot leaves in June or July | Under 2.3% fresh market, 2.4% processing |
Source: CDFA FREP fertilization guidelines, built from UC research.
Two cautions apply. The wheat guidelines say not to decide on a plant test alone, so pair the stem test with a soil test. The corn values come from other states, and the CDFA corn guidelines note that nobody has tested them in California.
How do you check rice at panicle initiation?
Nitrogen deficiency in rice shows as short, yellowish-green plants with narrow, upright leaves. The decision point is panicle initiation (PI), when the young panicle starts to form inside the stem. The CDFA rice guidelines put PI about 50 to 55 days after seeding in water-seeded rice. In drill-seeded rice, PI comes about 55 to 60 days after planting.
At PI, a test of the Y-leaf (the newest fully open leaf) under 3.2% nitrogen points to a deficiency. A leaf color chart gives a fast field check, with 8 panels that match 1.4% to 4.4% nitrogen.
Canopy sensors cover more of the field. In six Sacramento Valley trials, a UC Davis team compared a handheld GreenSeeker with a drone sensor (Sensors, 2023). They divided each reading by the reading over a strip with extra nitrogen, to give a sufficiency index. A PI top-dress raised yield at a GreenSeeker index of 0.96 or less. The authors estimated that the gain covers the application cost only at 0.86 or less.
A common local cause is a long early drain. In a CDFA-cited survey of 22 fields, a drained field formed about 1.8 pounds of nitrate-N per acre each day. After a 10 to 11 day drain, the field lost about 60% of that nitrate once the flood returned. Our rice fertilizer top-dressing guide covers the full decision.
What causes nitrogen deficiency in wheat?
Wheat short of nitrogen turns pale, with yellow that starts at the leaf tip. In the valley, it usually starts with winter rain, which can leach or denitrify preplant nitrogen. The CDFA wheat guidelines say that wheat takes up only 20 to 25% of its nitrogen before jointing. Late-fall-sown wheat takes up little nitrogen until late January or early February.
The guidelines therefore put the early-season nitrogen at tillering. In CDFA-cited trials, nitrogen at tillering to jointing gave about 10% more yield and 0.5 points more protein than preplant nitrogen. The response was larger when the top foot of soil held under 20 ppm nitrate-N at tillering.
The CDFA wheat guidelines list three tests:
- Soil nitrate quick test. Sample the top foot at tillering, before the top-dress.
- Stem nitrate. Send the lower 2 inches of 20 to 40 stems to the lab the same day.
- Chlorophyll meter. At Feekes 5 to 6, compare 30 or more readings with a well-fertilized reference strip.
A late 30 to 60 pounds of nitrogen per acre at flowering mainly raises grain protein, not yield.
What are the signs in corn and tomatoes?
In corn, a shortage starts as yellow at the tip of the lower leaves and moves down the midrib in a V shape. The leaf edges often stay green. For the pre-sidedress nitrate test (PSNT), guidelines from other states cut the sidedress rate above 10 ppm and skip it above 25 to 30 ppm. A leaf greenness reading under 90 to 96% of a well-fertilized strip also signals a need for nitrogen.
In tomatoes, a shortage shows as small, light green lower leaves, and purple veins can appear on young leaves. Most uptake happens between early fruit set and the first red fruit. In furrow-irrigated fields, a yield response was unlikely when the top 2 feet of soil held over 16 ppm nitrate-N before sidedress.
What does a nitrogen-short orchard look like?
In almonds, walnuts and prunes, spring leaves come out small and pale, the canopy looks thin, and fall leaves drop early. Nitrogen-short peach trees add red midribs and red stems, then red and brown leaf spots late in the season. The CDFA peach guidelines say not to sample a tree for at least one week after a foliar nitrogen spray.
Orchard values apply to summer leaf samples, but an April almond sample can predict July. Use this CDFA procedure for an almond block:
- Choose 28 trees at least 30 yards apart.
- On each tree, pick leaves from at least 8 well-exposed spurs.
- Take the spurs 5 to 7 feet above the ground, around the canopy.
- Put the leaves in a clean paper bag, and label it with the block and date.
- Send the sample to the lab.
- Compare the July result, or the July value predicted from April, with the table.
Below 2.0% in July, the guidelines warn that almond yield can fall 20% or more. Our orchards page covers the orchard work we fly.
Is it nitrogen, or something else?
Yellow leaves do not always mean low nitrogen. UC IPM notes that cold, wet soil, poor drainage, compaction, root rot, nematodes and poor irrigation can all block uptake. More fertilizer does not fix these causes.
| Problem | Where it shows first | Key sign |
|---|---|---|
| Nitrogen | Oldest leaves | Even pale yellow-green color over the whole leaf |
| Phosphorus | Older leaves | Dark green leaves, often with purple or red color |
| Potassium | Older leaves | Yellow or brown leaf edges; in corn the midrib stays green |
| Iron or manganese | Youngest leaves | Yellow between green veins |
| Zinc in orchards | New growth | Small, yellowish leaves in tufts |
| Wet or cold soil | Low spots or the whole field | Color returns when the soil drains and warms |
Sources: CDFA crop guidelines and the UC IPM table of nutrient deficiency symptoms.
How do you test for a nitrogen deficiency?
A good test compares a weak area with a healthy area of the same crop, as UC IPM advises. Use these steps:
- Mark the pale area and a healthy area on a field map.
- Take a tissue sample from each area at the stage the guidelines name.
- Take a soil sample from each area at the same depth.
- Send all samples to the same lab.
- Give the results to your certified crop adviser (CCA).
Our soil sampling and crop scouting guides help. Multispectral drone data can map pale zones before you sample.
To read a soil test, multiply ppm nitrate-N by 4 for pounds of nitrogen per acre in each foot. For well water, multiply ppm nitrate-N by 0.226 and by the acre-inches applied.
Nitrogen deficiency treatment: how do you fix it?
A fix works only inside the crop's uptake window. The CDFA guidelines give each crop's method, window and rate or season budget:
| Crop | Method and window | How much nitrogen |
|---|---|---|
| Rice | Dry top-dress on the flood, before PI | Ideally 30 lb N per acre or less; efficiency falls sharply above 60 lb |
| Wheat | Top-dress at tillering; liquid by air under 80 degrees F | No single rate; trials used 150 to 200 lb N per season, most at tillering; liquid by air 25 lb or less |
| Corn | Sidedress band, 3 to 4 leaf stage to tasseling | For 200 bushels: 200 to 240 lb total N at a PSNT under 10 ppm; 0 to 40 lb at 25 to 30 ppm |
| Tomatoes | Sidedress in furrow fields; fertigation on drip; stop at first red fruit | The fruit holds about 3 lb N per ton; a CDFA-linked calculator estimates the rate |
| Almonds | Four splits from the end of bloom to early postharvest | About 68 lb N per 1,000 lb of expected kernels, plus tree growth |
| Walnuts | Spring and summer, not after late June or early July | About 40 lb N leaves the orchard per ton of in-shell nuts |
| Prunes | About mid-April; a few weeks after petal fall if deficient | 10 to 15 lb N per dry ton, plus 30 to 40 lb per acre for tree growth |
| Peaches | Mid-spring, and after harvest while leaves are green | 25 to 75 lb N per acre a year for fresh market; 50 to 100 lb for processing |
Subtract the soil nitrate, the well-water nitrogen and the nitrogen you already applied. Your CCA sets the final rate. Foliar urea gives no consistent yield gain in well-fed orchards, and our post on foliar fertilizer explains when a leaf spray works.
Urea is 46% nitrogen and ammonium sulfate is 21%. So 30 pounds of nitrogen takes about 65 pounds of urea or 143 pounds of ammonium sulfate.
Caution: Do not overcorrect. Excess nitrogen can cause lodging in wheat, per CDFA, and UC IPM reports that it raises blast risk in rice.
Unused nitrogen can also reach groundwater. Under the state's Irrigated Lands Regulatory Program, many valley farms belong to the Sacramento Valley Water Quality Coalition, which publishes an annual nitrogen management report. Ask your coalition what records you must keep.
When does an aerial top-dress make sense?
An aerial application (crop dusting) puts fertilizer on the crop without a rig in the field. Rice at PI is the clearest case: the CDFA guidelines note that aircraft apply most rice top-dress on the flooded field. Wheat on wet ground after winter rain is the second case, because a rig leaves ruts. Our guide on how to hire a crop duster lists what to send the pilot.
Nitrogen top-dress flights from Live Oak
Sutter Butte Dusters flies dry and liquid fertilizer from 4080 Clark Rd in Live Oak, across Sutter, Yuba, Butte, Glenn, Colusa, Placer and Yolo counties. Rice is the main crop we fly, and we also fly wheat and other row crops. Our fleet has five Ag Cats and one Air Tractor 602. We top-dress at the rate your adviser sets, without wheel tracks in the crop. Learn more about our fertilizer service, or get a quote for your field.
Questions
It depends on the crop and the field. Urea is 46% nitrogen, so it takes less product per acre than ammonium sulfate at 21%. Ammonium sulfate also supplies sulfur. The CDFA rice guidelines rate them equal on rice when the soil has enough sulfur. Your adviser picks the product.
Yes. The CDFA guidelines warn that excess nitrogen can cause lodging and late maturity in wheat, and UC IPM reports that it raises blast risk in rice. Nitrogen the crop does not use can also leach to groundwater. A tissue test before you add more helps prevent waste.
Yes, when the water carries nitrate. The CDFA guidelines multiply the ppm nitrate-N by 0.226, then by the acre-inches applied. One acre-inch at 10 ppm supplies about 2.3 pounds of nitrogen per acre. Test your well and count this nitrogen in the plan.
A multispectral drone map shows pale or weak zones across a whole field, which helps you choose where to sample. It does not prove the cause. Wet soil, root disease and other nutrients can look the same, so confirm each zone with a tissue test.