
Pest management
CIMIS weather data: stations, ETo and degree days
By the Sutter Butte Dusters team · · 7 min read
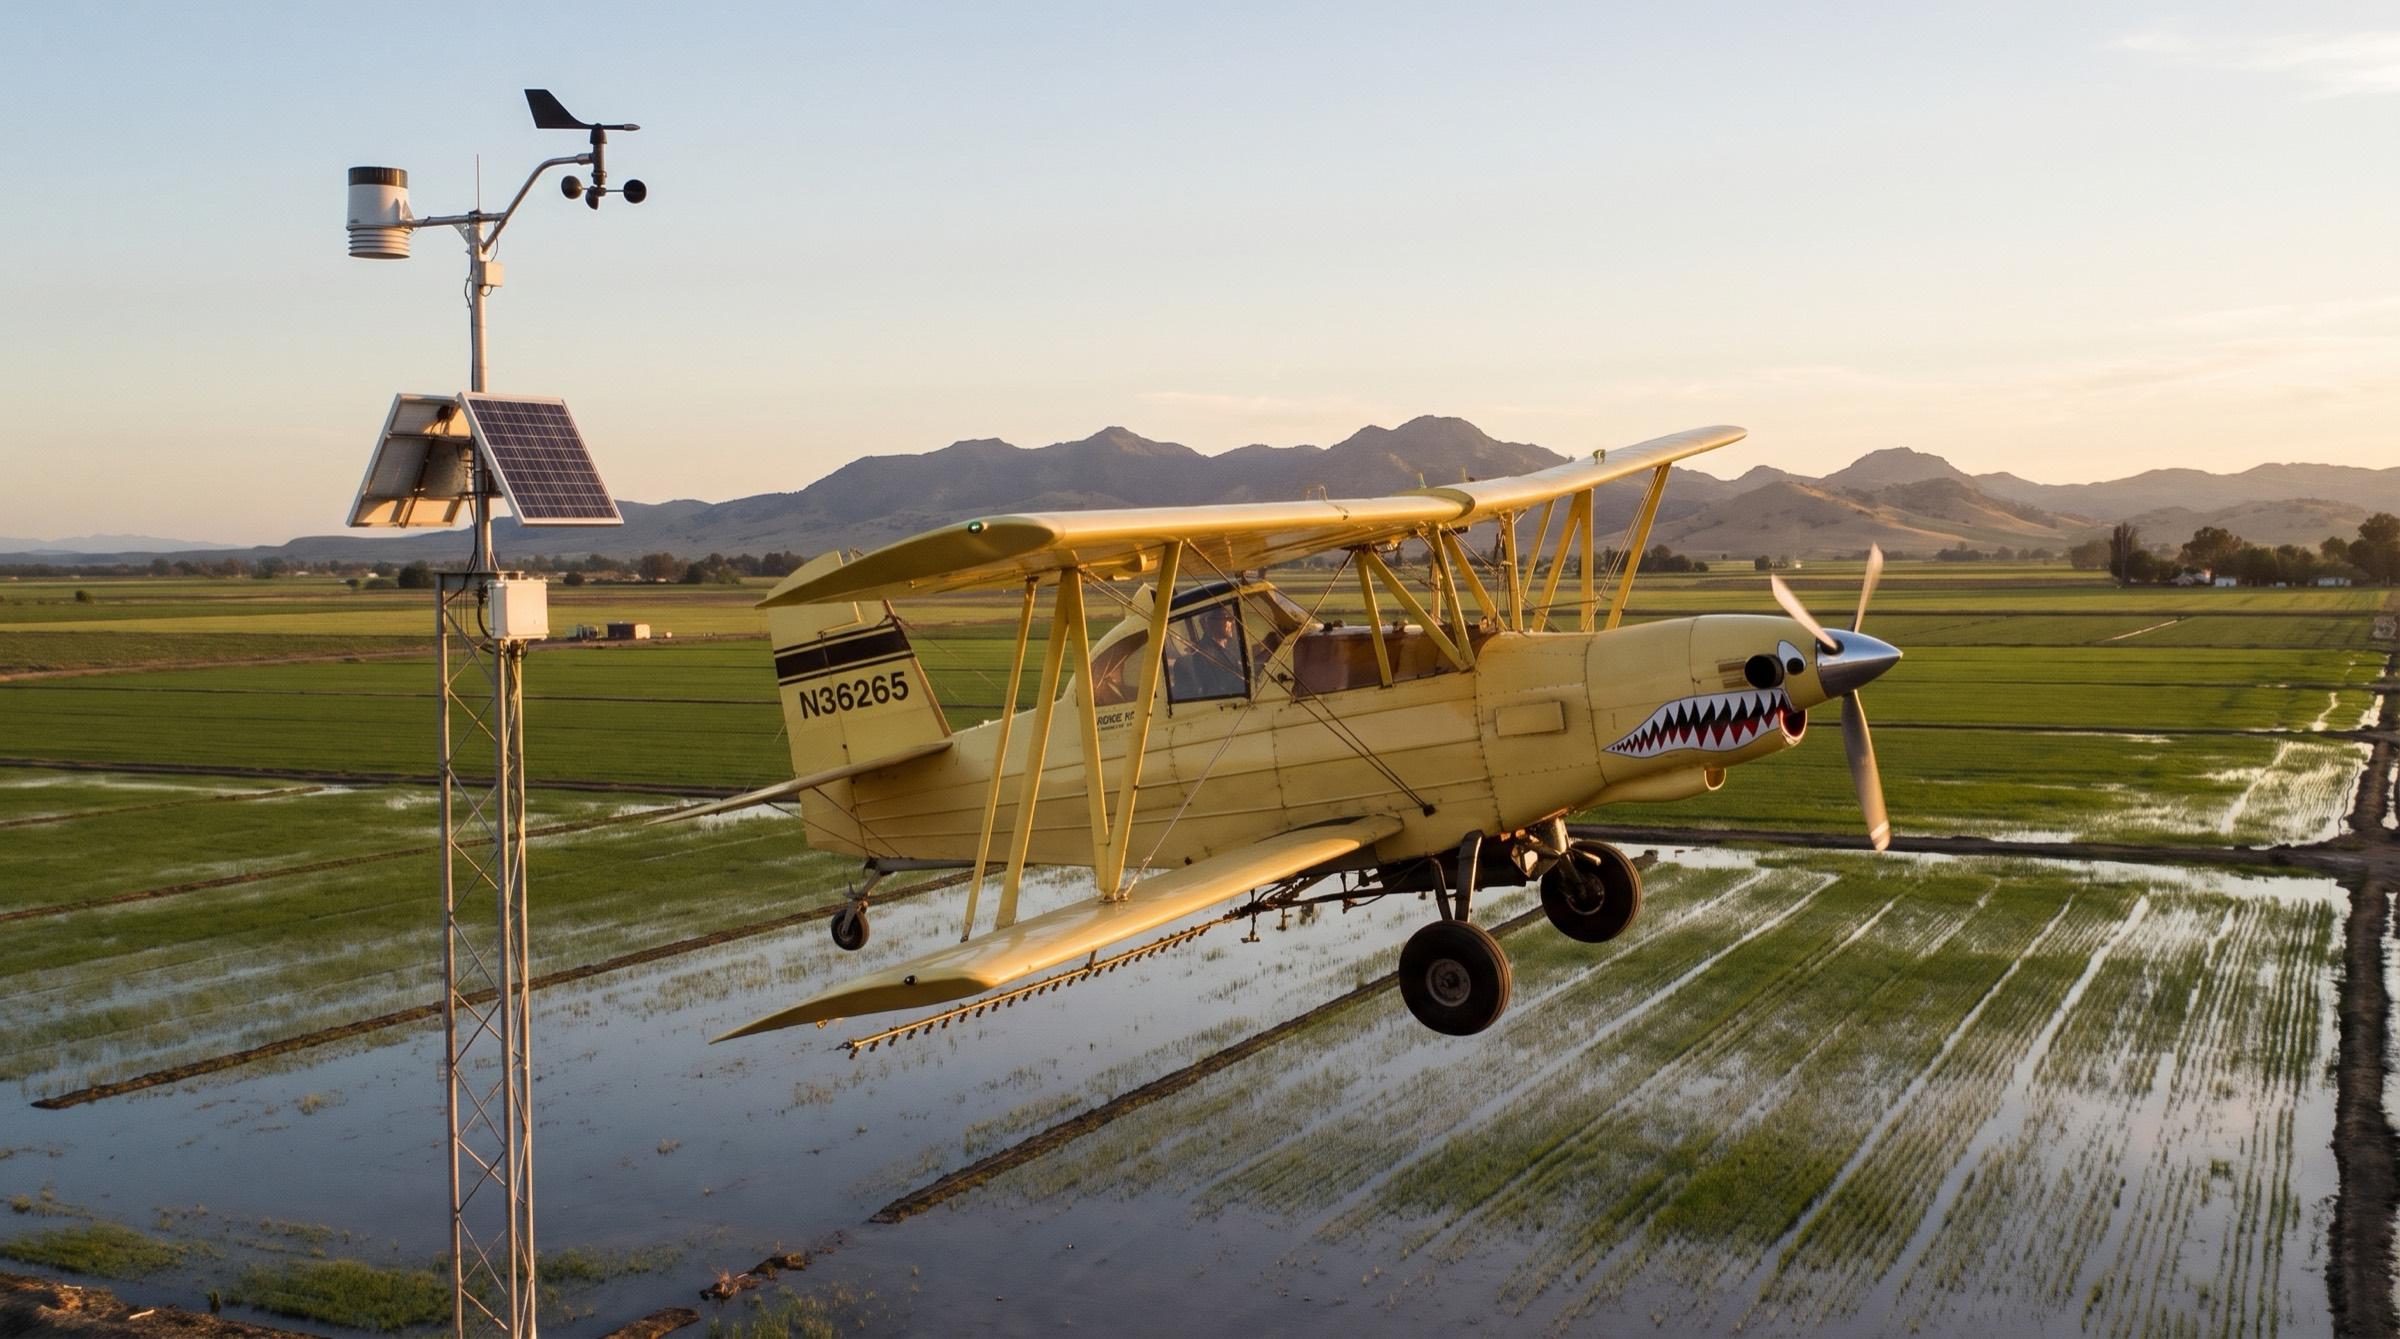
CIMIS is a free network of weather stations that the California Department of Water Resources (DWR) runs across the state. Growers use CIMIS data to schedule irrigation, and pest control advisers (PCAs) use the same temperatures to time sprays. This guide explains what each station measures, how ETo turns into crop water use, and how to find and download data for your field.
What is CIMIS?
CIMIS stands for the California Irrigation Management Information System. DWR has supplied reference evapotranspiration (crop water loss) estimates and rainfall data from it since 1982. The network now has over 145 active stations, and DWR keeps archived data for 85 stations that no longer report (CIMIS Spatial overview).
Each station stands in a field of irrigated grass. The CIMIS siting guide describes the ideal site as a well-kept cool-season grass pasture of 20 acres or more. The station sits in a fenced plot of 10 by 10 yards in the center, with grass mowed to 3 to 6 inches.
That grass surface matters. Bare soil around a station raises the temperature, lowers the humidity and pushes ETo up. DWR also asks hosts to keep stations away from areas with frequent applications of agricultural chemicals, because spray residue wears out the sensors.
What does a CIMIS station measure?
A CIMIS weather station records solar radiation, air temperature, relative humidity, wind, rain and soil temperature. The datalogger reads the sensors every minute and stores hourly sums or averages. All CIMIS times are Pacific Standard Time, so add one hour in summer.
| Variable | Sensor and height | Daily report value | Main use |
|---|---|---|---|
| ETo | Calculated from the other sensors | Inches per day | Irrigation scheduling |
| Air temperature | Thermistor at 1.5 meters (about 5 feet) | Maximum, minimum, average (°F) | Degree days, frost, chill |
| Relative humidity | Humidity sensor at 1.5 meters | Maximum, minimum, average (%) | Disease risk, ETo |
| Dew point | Calculated from temperature and humidity | °F | Frost and fog risk |
| Solar radiation | Pyranometer at 2 meters | Langleys per day (English units) | ETo |
| Wind speed and direction | Cup anemometer and vane at 2 meters | Average speed (mph), wind run (miles) | ETo, spray planning |
| Precipitation | Tipping-bucket rain gauge at 1 meter | Inches | Water budget |
| Soil temperature | Probe 6 inches deep under grass | Average (°F) | Planting dates |
Sources: the CIMIS sensor and data overview pages. A free daily report shows 14 of these values for each day.
The station wind is useful context for a spray day, but it is a 2-meter reading at one point. The pilot still checks the wind at the field before each application.
What is CIMIS ETo?
CIMIS ETo is the reference evapotranspiration (ETo). It is the water that a large field of well-watered grass, 3 to 6 inches tall, loses in one day. Evapotranspiration is the sum of evaporation from soil and leaves and transpiration through the plant.
CIMIS calculates ETo each hour with the American Society of Civil Engineers (ASCE) Standardized Penman-Monteith equation. It then adds the 24 hourly values, midnight to midnight, to get the daily ETo (CIMIS ET overview). In 2026, CIMIS made this equation the only method for both stations and Spatial CIMIS. The older CIMIS Penman equation is no longer supported.
ETo depends on four inputs: solar radiation, air temperature, humidity and wind speed. A hot, dry, windy day in July gives a high ETo. A foggy day in January gives a value near zero.
How do you turn ETo into crop water use?
Multiply ETo by a crop coefficient (Kc). The result is the crop evapotranspiration (ETc), the water that your crop uses:
ETc = ETo × Kc
The Kc is a number without units, usually between 0.1 and 1.2. It changes with the crop, the growth stage and some cultural practices. CIMIS gives an example for an orange tree in July. An ETo of 0.25 inches per day times a Kc of 0.55 gives about 0.14 inches per day.
Use only crop coefficients that researchers developed for grass-reference ETo. An almond orchard with a cover crop between the rows has a higher Kc than a clean orchard floor. UC Cooperative Extension leaflets 21427 (field and vegetable crops) and 21428 (trees and vines) list coefficients for use with CIMIS ETo.
What is Spatial CIMIS?
Spatial CIMIS estimates daily ETo for any point in California, not only at a station. It combines satellite images from the NOAA GOES weather satellite with interpolated station data. The model uses the same ASCE Penman-Monteith equation.
From June 2026, Spatial CIMIS reports ETo on a grid of 500 meters (about 1,640 feet). Earlier data use a 2-kilometer grid. The daily record starts on February 20, 2003. You can search by ZIP code, map coordinates or street address after you register and log in.
Spatial CIMIS helps when the nearest station is far away or sits in a different climate. It gives ETo and solar radiation only. It does not give the hourly air temperatures that pest and chill models need.
Which CIMIS station is nearest to my field?
The table shows CIMIS stations in and next to our service area. We checked each one in the CIMIS station list in November 2026.
| County | Active station (number, start date) | Retired stations |
|---|---|---|
| Sutter | Verona (235, May 2012) | Nicolaus (30) |
| Butte | Biggs (244, June 2015) | Durham (12) |
| Yuba | Browns Valley (84, April 1989) | None |
| Colusa | Williams (250, August 2016) | Colusa (32) |
| Glenn | None | Orland (14), Orland (61) |
| Tehama | Gerber South (222, August 2014) | Gerber (8), Gerber Dryland (108) |
Glenn County has no active CIMIS station. Growers there can compare data from Williams, Biggs and Gerber South. CIMIS puts Browns Valley in its Sierra foothill region, not the Sacramento Valley region. Its weather can differ from a valley floor orchard.
A retired station still has archived data. You can use Nicolaus or Durham data for a past season, but not for this week.
How do you download CIMIS weather data?
The free reports need no account. A free daily report covers the past 7 days, ends yesterday, and shows the data on the screen. For longer date ranges or a CSV file, register for a free CIMIS account.
Caution: Check the station status before you use the data for a spray date. A station that stopped last month gives you old numbers without a warning on your spreadsheet.
Find your station and download daily data:
- Open the CIMIS station list on cimis.water.ca.gov.
- Type your county name in the search box.
- Choose an active station in the same climate as your field.
- Write down the station number.
- Open the Data menu and select Station Reports.
- Select Limited Daily Report and English units.
- Select your station and run the report.
- For a longer record, register and log in.
- Select a Daily Report, your station, and the start and end dates.
- Select CSV format and save the file.
CIMIS marks a value with a quality control flag when its checks find a data problem. Compare a flagged or missing value with the next nearest station before you add it to a running total.
How do PCAs use CIMIS for degree days?
Insects develop faster in warm weather. A degree day (DD) is one day at 1°F above the lower development threshold of a pest. Your PCA adds the degree days from a start event, the biofix, and predicts egg hatch or the next flight. Our post on growing degree days explains the formula and the thresholds.
The UC IPM degree-day calculator uses weather data from CIMIS stations or UC IPM PestCast stations. You set the lower and upper thresholds and the calculation method. The pest models on that site have these values already set. Our guide to the UC IPM website shows where each pest model lives.
The calculator uses the daily maximum and minimum air temperature. When you do not know the method for a model, UC IPM recommends the single sine method with a horizontal cutoff.
Our free NorCal spray timing tracker also uses daily maximum and minimum temperatures. It counts degree days since biofix for navel orangeworm, codling moth and peach twig borer, and shows the UC IPM treatment window. The tracker uses one farm town in each county. A CIMIS station or an orchard sensor near your block gives a more exact count.
Hourly CIMIS temperatures also feed winter chill models. Our post on chill hours and chill portions explains how growers track chill for walnuts, almonds and prunes.
CIMIS data and our spray schedule
We fly orchard and rice applications across Sutter, Yuba, Butte, Glenn, Colusa, Placer and Yolo counties from our strip in Live Oak. Many orchard insecticide sprays follow a degree-day count from CIMIS or PestCast temperatures. When your PCA's count shows that the window is a week away, send us the recommendation and the field map. Our usual time from your call to a plane over the field is 24 hours. To book the flight, get a quote for your field.
Questions
Yes. Anyone can run a limited daily report for the past 7 days without an account. For longer date ranges, CSV files, data from retired stations and Spatial CIMIS reports, register for a CIMIS account and log in.
ETo is the water that a field of well-watered grass loses in one day. ETc is the water that your crop loses. Multiply ETo by the crop coefficient (Kc) for your crop and growth stage to get ETc.
Yes. Verona (station 235) has reported since May 2012. The older Nicolaus station (30) is retired, but its archived data are still available. Nearby active stations include Biggs (244) in Butte County and Browns Valley (84) in Yuba County.
Spatial CIMIS estimates daily ETo and solar radiation for any point in California. It combines GOES satellite images with station data. From June 2026 it uses a 500-meter grid. It does not give the hourly temperatures that pest and chill models need.